Wednesday, July 15, 2015

Monday, July 13, 2015
Perwaja (5146); Long Term investor eyeing it !!!
Executive Summary
Most strongest and longest wave 3 was formed on 2nd of July'15(break out $0.26) and heading to the long term investor target of $0.505/$0.704, Med term investor toward future traders were bought in last week(WW27), strong evident showed prices well support and stay above $0.260Base on past history data and TA analysis, most likely next move up will kick in toward extended wave 5 target of $0.390/$0.420. Short term toward FIFO trader may target on $0.360/$0.400.
I am anticipating immediate resistance $0.330 will be remove on next swing up and moving toward $0.360/$0.390/$0.420. If any weakness toward immediate support @ $0.285/$0.290 is provide good opportunity for me to collect.
I will stop loss if Price go below $0.260.
Technical Justification(bullish)
Elliot wave
Cycle wave(Institutional Investor) is wave 3 and it is most strongest and longest wave in Elliott wave theory, base on the chart below is demonstrated wave 3 is confirm by price move beyond and $0.260, it also successfully stay above $0.260 which supported by strong evident of price been retest couple of time on 2nd/6th/8th of July. target of Wave 3 is $0.505/$0.740
Primary wave(Long Term Investor) 3 development is ongoing which is moving toward the target of $0.360/$0.660. follow by Intermediate and minor wave degree, which is under extended wave 5 and wave 3 development, it is moving toward $0.390/$0.420


4 stages Market

Market 4 stages
Stage 1 Accumulation : Stock is accumulating by Smart money or professional trader.
Stage 1 Accumulation : Stock is accumulating by Smart money or professional trader.
Stage 2 Mark Up : Stock is marking up to higher prices for better value.
Stage 3 Distribution : Stock is Distributing or change from the strong holder to weak holder.
Stage 4. Mark down : Stock prices degraded and no more support by strong holder
We are going ending stage 1 with double bottom break out !!! stage 2 is kick in now and market being mark up toward very $0.740/$1.80
Note :I did analysis in Evergreen on Jan'15, it is very similate Market 4 stage. http://klseelwavetrading.blogspot.com/2015/01/evergreen-only-bull-in-bear-market.html
1. China’s Zhiyuan steps in early to revive Perwaja - The Malaysian Insider
http://www.themalaysianinsider.com/business/article/chinas-zhiyuan-steps-in-early-to-revive-perwaja
2. China's Zhiyuan Group to inject RM300m into Perwaja | theSundaily
http://m.thesundaily.my/node/308721
3.Perwaja has until July 31, 2015 to submit its restructuring plan to the authorities - See more at: http://m.thesundaily.my/node/308721#sthash.lvZWPfYy.dpuf.


Trading Challenge
We are going ending stage 1 with double bottom break out !!! stage 2 is kick in now and market being mark up toward very $0.740/$1.80
Note :I did analysis in Evergreen on Jan'15, it is very similate Market 4 stage. http://klseelwavetrading.blogspot.com/2015/01/evergreen-only-bull-in-bear-market.html
Environment Scan
News Keep on out and talking about capital injection, base on TA show most likely it will come truth1. China’s Zhiyuan steps in early to revive Perwaja - The Malaysian Insider
http://www.themalaysianinsider.com/business/article/chinas-zhiyuan-steps-in-early-to-revive-perwaja
2. China's Zhiyuan Group to inject RM300m into Perwaja | theSundaily
http://m.thesundaily.my/node/308721
3.Perwaja has until July 31, 2015 to submit its restructuring plan to the authorities - See more at: http://m.thesundaily.my/node/308721#sthash.lvZWPfYy.dpuf.


Trading Challenge
Many people committed to buy stock is very easy, when come to profit taking and cut loss is one of the most difficult part in trading world, talking about profit taking is dealing with greed and stop loss is dealing with fear, cutting loss is a must in trading world because it stopping my capital continue to loss, in order to stay alive in trading world... it is a must !!! it is not an option, else I suggest you get out of the trading and you are not suitable.
I wanted to used simple example to share on the cut loss ... you bought an egg and prepare to used it for fry rice, some how you notice/suspect the eggs you pick was/may turn bad.... the question now is shall out throw/scrap the bad one and pick another .... or nevermind bet or hope the suspicious "bad" egg will be good and risk the good rice which is ready to cook ? you make the call... I am believed in order to win I got to know how to prevent I am loss in the market... if I notice I am wrong... I got to admit and cut the loss and make a next move.
As a reminder for myself
I am always remind myself If the trend is go again me and violated my SL limit, I will cut loss base on the risk preference.
Stop Loss is painful process because I making loss, but it is necessary to take it, it is very important because it protect my capital to ensure I am stay in the market.
DISCLAIMER:
Stock analysis and comments presented on klseelwavetrading.blogspot.com are solely for education purpose only. They do not represent the opinions of klseelwavetrading.blogspot.com on whether to buy, sell or hold shares of a particular stock.
Investors should be cautious about any and all stock recommendations and should consider the source of any advice on stock selection. Various factors, including personal or corporate ownership, may influence or factor into an expert's stock analysis or opinion.
All investors are advised to conduct their own independent research into individual stocks before making a purchase decision. In addition, investors are advised that past stock performance is no guarantee of future price appreciation.
All investors are advised to conduct their own independent research into individual stocks before making a purchase decision. In addition, investors are advised that past stock performance is no guarantee of future price appreciation.
Moving Average Convergence Divergence - MACD

DEFINITION OF 'MOVING AVERAGE CONVERGENCE DIVERGENCE - MACD'
A trend-following momentum indicator that shows the relationship between two moving averages of prices. The MACD is calculated by subtracting the 26-day exponential moving average (EMA) from the 12-day EMA. A nine-day EMA of the MACD, called the "signal line", is then plotted on top of the MACD, functioning as a trigger for buy and sell signals.
Moving Average Convergence Divergence

1. Crossovers - As shown in the chart above, when the MACD falls below the signal line, it is a bearish signal, which indicates that it may be time to sell. Conversely, when the MACD rises above the signal line, the indicator gives a bullish signal, which suggests that the price of the asset is likely to experience upward momentum. Many traders wait for a confirmed cross above the signal line before entering into a position to avoid getting getting "faked out" or entering into a position too early, as shown by the first arrow.
2. Divergence - When the security price diverges from the MACD. It signals the end of the current trend.
3. Dramatic rise - When the MACD rises dramatically - that is, the shorter moving average pulls away from the longer-term moving average - it is a signal that the security is overbought and will soon return to normal levels.
Traders also watch for a move above or below the zero line because this signals the position of the short-term average relative to the long-term average. When the MACD is above zero, the short-term average is above the long-term average, which signals upward momentum. The opposite is true when the MACD is below zero. As you can see from the chart above, the zero line often acts as an area of support and resistance for the indicator.
Saturday, July 11, 2015
Group Think Vs Trading Plan
The following article is written by Matrixcool :
Group Think Vs Trading Plan
I always want to write this article to tell my readers about the important of a Trading Plan and finally I got my son to help me to put it down on words.
This happens a lot in social circles and discussion boards. It comes from insecurity. You've seen it many times, someone comes into a conversation and they say things like, "I think this counter xyz going to move in a big way tomorrow, I heard it from Mr. ABC. You guys think it's a great opportunity right?". What seems to be an innocent and harmless "hearsay" stock tip is actually an individual seeking confirmation from his or her peers. That means that person, on a deep subconscious level, is actually not sure whether or not this is a good idea to trade in Counter XYZ. That person has no confidence in their own system or trading plan, or even worse - they have absolutely no plan to begin with. They want to hear people say to them, "Yeah! sure make money bro!", so that they can feel secure. Do not be like that person, as you have no reason to be.
You are armed with technical knowledge, and you have many opportunities to research a counter before going into a trade. Not even that is fool-proof, but a trader with a plan is bound to succeed more than an insecure group-thinking person. Why?
Simply because doing the hard work and analysis gives you a structure on how you will do your trading. After that you set your own trading plan, know your Entry Price ,Potential Rewards and Stop Loss level. You already have the three most important parts of information for when things go right, or when things go wrong. Meaning to say, you don't need to ask ANYBODY for confirmation on whether or not the trade is going to be a smart trade. This is because you know exactly when you want to go in, or when to pull out. If you stick with your trading strategy and plan, you need not worry about someone else's insecure statements like, "Aiyoo I think this counter going to go down further lah!".
I've seen big groups of people being dragged down by one outspoken, insecure trader - because they were not strong-willed or disciplined traders themselves. With that in mind, always remember to separate your emotions from your technical analysis. It's impossible not to feel any emotion, but try to be as objective as possible. Stay away from insecure people trying to take other people into their black hole of insecurity. Avoid group think, and contribute / help other traders on a basis of confidence and discipline.
China market stable and rebound can last how long?
Analysts at Brown Brothers Harriman explained that China’s recent actions to stabilize equity markets became increasingly desperate.
Key Quotes:
"More and more measures were rolled out as the week progressed and losses mounted, but the equity markets finally stabilized going into the weekend. However, nearly half the mainland stocks are still locked up and unable to trade. "
"As such, we cannot yet sound the all clear. China’s heavy-handed meddling in the local equity markets may ultimately derail its bid to have A-shares included in MSCI’s indices."
Greek banks reopen by the end of next week ?
Greek banks are expected to reopen by the end of next week if institutions approve Greek bailout proposal on Sunday, according to a senior banking source via Reuters.
Greek banks have remaining liquidity of approximately €750 million that will last until Monday night, with ATM outflows averaging about € 80-100 million a day.
Even if a deal between Greece and its creditors is finally reached, Greek banks will still need recapitalization of around €10-14 billion.
Meanwhile, Greece’s brand new finance minister Euclid Tsakalotos stated that Greek capital controls can be quickly reversed.
Friday, July 10, 2015
Fibonacci Sequence

R. N. Elliott's analysis of the mathematical properties of waves and patterns eventually led him to conclude that "The Fibonacci Summation Series is the basis of The Wave Principle".Numbers from the Fibonacci sequence(1,2,3,5,8,13,21,34,55....) surface repeatedly in Elliott wave structures, including motive waves (1, 3, 5), a single full cycle (8 waves), and the completed motive (89 waves) and corrective (55 waves) patterns. Elliott developed his market model before he realized that it reflects the Fibonacci sequence. "When I discovered The Wave Principle action of market trends, I had never heard of either the Fibonacci Series or the Pythagorean Diagram".
The Fibonacci sequence is also closely connected to the Golden ratio (1.618). Practitioners commonly use this ratio and related ratios to establish support and resistance levels for market waves, namely the price points which help define the parameters of a trend.
Finance professor Roy Batchelor and researcher Richard Ramyar, a former Director of the United Kingdom Society of Technical Analysts and formerly Global Head of Research at Lipper and Thomson Reuters Wealth Management, studied whether Fibonacci ratios appear non-randomly in the stock market, as Elliott's model predicts. The researchers said the "idea that prices retrace to a Fibonacci ratio or round fraction of the previous trend clearly lacks any scientific rationale". They also said "there is no significant difference between the frequencies with which price and time ratios occur in cycles in the Dow Jones Industrial Average, and frequencies which we would expect to occur at random in such a time series".
Robert Prechter replied to the Batchelor–Ramyar study, saying that it "does not challenge the validity of any aspect of the Wave Principle...it supports wave theorists' observations," and that because the authors had examined ratios between prices achieved in filtered trends rather than Elliott waves, "their method does not address actual claims by wave theorists". The Socionomics Institute also reviewed data in the Batchelor–Ramyar study, and said these data show "Fibonacci ratios do occur more often in the stock market than would be expected in a random environment".
Extracted from the same relationship between Elliott Waves and Fibbonacci ratio, a 78.6% retracement level is identified as a best place for buying or selling (in continuation to the larger trend) as it increases the risk to reward ratio up to 1:3.
It has been suggested that Fibonacci relationships are not the only irrational number based relationships evident in waves.
TA Tool : Stochastic Oscillator

Stochastic Oscillator
DEFINITION OF 'STOCHASTIC OSCILLATOR'
A technical momentum indicator that compares a security's closing price to its price range over a given time period. The oscillator's sensitivity to market movements can be reduced by adjusting the time period or by taking a moving average of the result. This indicator is calculated with the following formula:
%K = 100[(C - L14)/(H14 - L14)]
C = the most recent closing price
L14 = the low of the 14 previous trading sessions
H14 = the highest price traded during the same 14-day period.
%D = 3-period moving average of %K
Stochastic Oscillator
INVESTOPEDIA EXPLAINS 'STOCHASTIC OSCILLATOR'
The theory behind this indicator is that in an upward-trending market, prices tend to close near their high, and during a downward-trending market, prices tend to close near their low. Transaction signals occur when the %K crosses through a three-period moving average called the "%D".
What is Fibonacci Retracement


What is Fibonacci retracement, and where do the ratios that are used come from?
By Casey Murphy
Fibonacci retracement is a very popular tool among technical traders and is based on the key numbers identified by mathematician Leonardo Fibonacci in the thirteenth century. However, Fibonacci's sequence of numbers is not as important as the mathematical relationships, expressed as ratios, between the numbers in the series. In technical analysis, Fibonacci retracement is created by taking two extreme points (usually a major peak and trough) on a stock chart and dividing the vertical distance by the key Fibonacci ratios of 23.6%, 38.2%, 50%, 61.8% and 100%. Once these levels are identified, horizontal lines are drawn and used to identify possible support and resistance levels. Before we can understand why these ratios were chosen, we need to have a better understanding of the Fibonacci number series.
The Fibonacci sequence of numbers is as follows: 0, 1, 1, 2, 3, 5, 8, 13, 21, 34, 55, 89, 144, etc. Each term in this sequence is simply the sum of the two preceding terms and sequence continues infinitely. One of the remarkable characteristics of this numerical sequence is that each number is approximately 1.618 times greater than the preceding number. This common relationship between every number in the series is the foundation of the common ratios used in retracement studies.
The key Fibonacci ratio of 61.8% - also referred to as "the golden ratio" or "the golden mean" - is found by dividing one number in the series by the number that follows it. For example: 8/13 = 0.6153, and 55/89 = 0.6179.
The 38.2% ratio is found by dividing one number in the series by the number that is found two places to the right. For example: 55/144 = 0.3819.
The 23.6% ratio is found by dividing one number in the series by the number that is three places to the right. For example: 8/34 = 0.2352.
For reasons that are unclear, these ratios seem to play an important role in the stock market, just as they do in nature, and can be used to determine critical points that cause an asset's price to reverse. The direction of the prior trend is likely to continue once the price of the asset has retraced to one of the ratios listed above. The following chart illustrates how Fibonacci retracement can be used. Notice how the price changes direction as it approaches the support/resistance levels.
In addition to the ratios described above, many traders also like using the 50% and 78.6% levels. The 50% retracement level is not really a Fibonacci ratio, but it is used because of the overwhelming tendency for an asset to continue in a certain direction once it completes a 50% retracement.
Elliot Wave

The Elliott wave principle is a form of technical analysis that some traders use to analyze financial market cycles and forecast market trends by identifying extremes in investor psychology, highs and lows in prices, and other collective factors. Ralph Nelson Elliott (1871–1948), a professional accountant, discovered the underlying social principles and developed the analytical tools in the 1930s. He proposed that market prices unfold in specific patterns, which practitioners today call Elliott waves, or simply waves. Elliott published his theory of market behavior in the book The Wave Principle in 1938, summarized it in a series of articles in Financial World magazine in 1939, and covered it most comprehensively in his final major work, Nature’s Laws: The Secret of the Universe in 1946. Elliott stated that "because man is subject to rhythmical procedure, calculations having to do with his activities can be projected far into the future with a justification and certainty heretofore unattainable.
Greece bailout !
“The bigger event this weekend for the Eurozone & global financial markets would be the Greece bailout ultimatum which could be decided by this Sunday (12 Jul). The Greek government led by PM Alexis Tsipras has submitted the detailed reform proposals in exchange for a three-year bailout loan of at least EUR53.5 billion and reports said that the latest Greek bailout reform plan (which included pension savings and tax increases) is broadly similar to the one proposed by the international creditors on 26 June 2015, giving hope that a compromise can be reached.”
The latest plan was submitted less than 2 hours before the Thursday (9 Jul) midnight deadline and will be presented to the Greek Parliament later today (10 Jul). The Eurozone finance ministers can meet on Saturday (11 Jul) to review the [expected] Greek proposals for a new bailout loan before the 28 EU leaders summit in Brussels on Sunday (12 Jul) that could sign off on a new bailout deal for Greece.”
Looking ahead, we have the key employment report from Canada while Fed Chair Yellen’s speech later tonight will also be closely watched.
Tuesday, July 7, 2015
Carepls (0163) Making new high is on going ???
Executive Summary.
I bought in Carepls on Friday (3rd/July) due to falling window gap closed(bullish implication), I did collected some amount around 0.745 during the CI dip 25pts (opportunity to collect), Volume and price spike at noon to test immediate resistance at $0.800, but rejected due to weak sentiment. My personal assessment base on Elliot wave and Basic Technical analysis on CAREPLS, Most likely next move up should kick in very soon and immediate resistance ($0.800) will be remove. and heading to my target @ $ 0.850/0.880.I anticipate it will face resistance challenge along the path to the target, the resistance line are $0.800(should be remove)/$0.820(fibo profit target), My trade plan is lock partial profit and apply trailing stop along resistance line, Full profit at $0.880. I will collect more if found weakness and correction toward $0.730, I will stop loss if prices close below $0.715.
Technical Justification(Bullish)
1. Four consecutive positive Elliott wave is pointing to up trend, From Primary, intermediate , Minor and Minute wave degree.Primary Wave target : $1.01

Intermediate Wave $0.880

Minor Wave $ 1.20

Minute Wave $ 0.850

2. KLSE CI downtrend and this stock go again CI index, Pass data suggested after CI stabilized, this stock most like like will go up strongly, I do observed FKLI reversal signal showed up and immediate support at 1700

2. Keep on building higher High and higher low, it is very significant evident uptrend is on going
3. Uptrend Line angle uplifting, it is strong justification more upswing to try next resistance and will be broken.
4. Gap down build up on 29th/Jun been filled on Friday, it indicate next swing up is on making now


Environment Scan (who is riding/Pick this stock)
1. Fred Tam (Malaysia Pioneer Technical Analysis)
2. Dr Nazri Khan(Head of Retain Research AFFIN Investment Bank)
3. Matrixcool ( Super Trader)
4. Chartian.( Famous online trainer)
5. Logic Trading Analysis ( Famous Rabbit scanner developer)
5. Jason Wong ( KLSE TA blogger).
Trading Challenge
Many people committed to buy stock is very easy, when come to profit taking and cut loss is one of the most difficult part in trading world, talking about profit taking is dealing with greed and stop loss is dealing with fear, cutting loss is a must in trading world because it stopping my capital continue to loss, in order to stay alive in trading world... it is a must !!! it is not an option, else I suggest you get out of the trading and you are not suitable.
I wanted to used simple example to share on the cut loss ... you bought an egg and prepare to used it for fry rice, some how you notice/suspect the eggs you pick was/may turn bad.... the question now is shall out throw/scrap the bad one and pick another .... or nevermind bet or hope the suspicious "bad" egg will be good and risk the good rice which is ready to cook ? you make the call... I am believed in order to win I got to know how to prevent I am loss in the market... if I notice I am wrong... I got to admit and cut the loss and make a next move.
As a reminder for myself
I am always remind myself If the trend is go again me and violated my SL limit, I will cut loss base on the risk preference.
Stop Loss is painful process because I making loss, but it is necessary to take it, it is very important because it protect my capital to ensure I am stay in the market.
DISCLAIMER:
I am always remind myself If the trend is go again me and violated my SL limit, I will cut loss base on the risk preference.
Stop Loss is painful process because I making loss, but it is necessary to take it, it is very important because it protect my capital to ensure I am stay in the market.
DISCLAIMER:
Stock analysis and comments presented on klseelwavetrading.blogspot.com are solely for education purpose only. They do not represent the opinions of klseelwavetrading.blogspot.com on whether to buy, sell or hold shares of a particular stock.
Investors should be cautious about any and all stock recommendations and should consider the source of any advice on stock selection. Various factors, including personal or corporate ownership, may influence or factor into an expert's stock analysis or opinion.
All investors are advised to conduct their own independent research into individual stocks before making a purchase decision. In addition, investors are advised that past stock performance is no guarantee of future price appreciation.
All investors are advised to conduct their own independent research into individual stocks before making a purchase decision. In addition, investors are advised that past stock performance is no guarantee of future price appreciation.
Thursday, July 2, 2015
Eforce is just moving up !!! time to catch the train ?
Pls click to get instant update and Weekly news letter (Free of Charge)
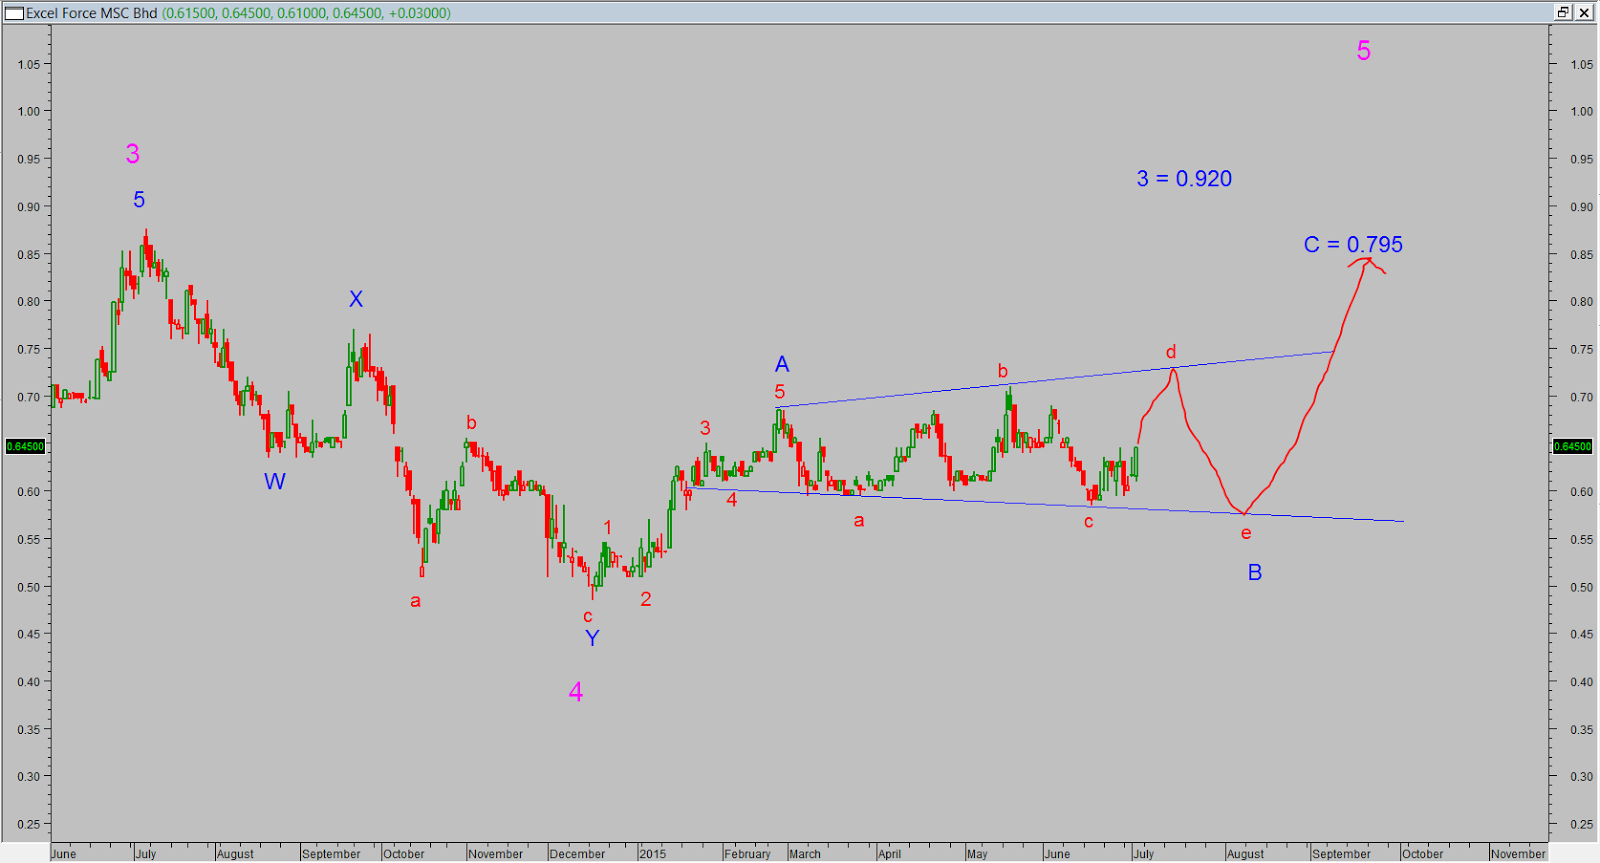
Executive Summary (E FORCE)
Big white candle formed with sufficient volume to kick start bull ran on today,I am anticipating price most likely will continue to go up and heading to target prices of $0.730/$0.795, we should faced resistance along the path to the target, there are $0.680/$0.705.The technical judgment I make are supported by my personal assessment, which is base on the pass history results. I will explain it at under technical justification.
My Trade Plan
I will stop loss if prices go below $0.600.If that is weakness happen I will collect it at $ 0.610.
I will lock partial profit along the resistance point and full profit on my target.
I will apply trailing stop after pass the resistance price.
Technical Justification( Bullish Implication ).


(42 profit/19 loss)
Candle formed big while soldiers with sufficient good volume, it is good indication bull ran is kick start and high possibility next two day will close green.
Technical Bread


Description
Flats are very common forms of corrective patterns, which
generally show a sideways direction. Waves A and B of the Flat are both
corrective patterns. Wave C on the contrary is an impulsive pattern. Normally
wave C will not go beyond the end of wave A.
Rules and guidelines
• It is composed of 3 waves.
• Wave C
is an impulse, wave A and B are corrective.
• Wave B retraces more then 61.8%
of A.
• Wave B often shows a complete retracement to the end of the previous
impulse wave.
• Wave C shouldn’t go beyond the end of A.
• Normally wave C is
at least equal to A
Big white Candle

Trading Challenge
Many people committed to buy stock is very easy, when come to profit taking and cut loss is one of the most difficult part in trading world, talking about profit taking is dealing with greed and stop loss is dealing with fear, cutting loss is a must in trading world because it stopping my capital continue to loss, in order to stay alive in trading world... it is a must !!! it is not an option, else I suggest you get out of the trading and you are not suitable.
I wanted to used simple example to share on the cut loss ... you bought an egg and prepare to used it for fry rice, some how you notice/suspect the eggs you pick was/may turn bad.... the question now is shall out throw/scrap the bad one and pick another .... or nevermind bet or hope the suspicious "bad" egg will be good and risk the good rice which is ready to cook ? you make the call... I am believed in order to win I got to know how to prevent I am loss in the market... if I notice I am wrong... I got to admit and cut the loss and make a next move.
As a reminder for myself
I am always remind myself If the trend is go again me and violated my SL limit, I will cut loss base on the risk preference.
Stop Loss is painful process because I making loss, but it is necessary to take it, it is very important because it protect my capital to ensure I am stay in the market.
DISCLAIMER:
I am always remind myself If the trend is go again me and violated my SL limit, I will cut loss base on the risk preference.
Stop Loss is painful process because I making loss, but it is necessary to take it, it is very important because it protect my capital to ensure I am stay in the market.
DISCLAIMER:
Stock analysis and comments presented on klseelwavetrading.blogspot.com are solely for education purpose only. They do not represent the opinions of klseelwavetrading.blogspot.com on whether to buy, sell or hold shares of a particular stock.
Investors should be cautious about any and all stock recommendations and should consider the source of any advice on stock selection. Various factors, including personal or corporate ownership, may influence or factor into an expert's stock analysis or opinion.
All investors are advised to conduct their own independent research into individual stocks before making a purchase decision. In addition, investors are advised that past stock performance is no guarantee of future price appreciation.
All investors are advised to conduct their own independent research into individual stocks before making a purchase decision. In addition, investors are advised that past stock performance is no guarantee of future price appreciation.