Sunday, August 31, 2014

KPS, How to protect and Maximize my profit through unfold most probability wave degree

This page is a part II of the previous post, which is "When and which target should I take profit through unfold every wave degree of KPS Part ", refer to the URL below if you miss the post.

http://klseelwavetrading.blogspot.com/2014/08/when-and-which-target-should-i-take.html

Note from (黄睦焜): before I go to start this page, I would like to take this opp to thanks for a wise man name TG Lee (KLSE Technical Analysis Discussion in FB forum), he is the one who are mentoring and nurturing many new trader. After have a opp interaction with him in the forum...he did influence/shift certain degree of my thought process...again sincere thanks for you coaching.

here is my trade plan,which is deal with real money and the amount is not big, which is just about 100 standard lot(100 units), this is for my own reference and not intend to instruct/advise anyone to follow my trade plan.

I did check the KPS chart and it does showed up have more than 10 alternates wave degree, I know it may will confused many ppls included those who are long in the elliot wave trading, it is not an easy ... but it worth it to spend time to study it. because this tool is used by many great trader like institution and long term investor... I chosen the most high probability(T3)
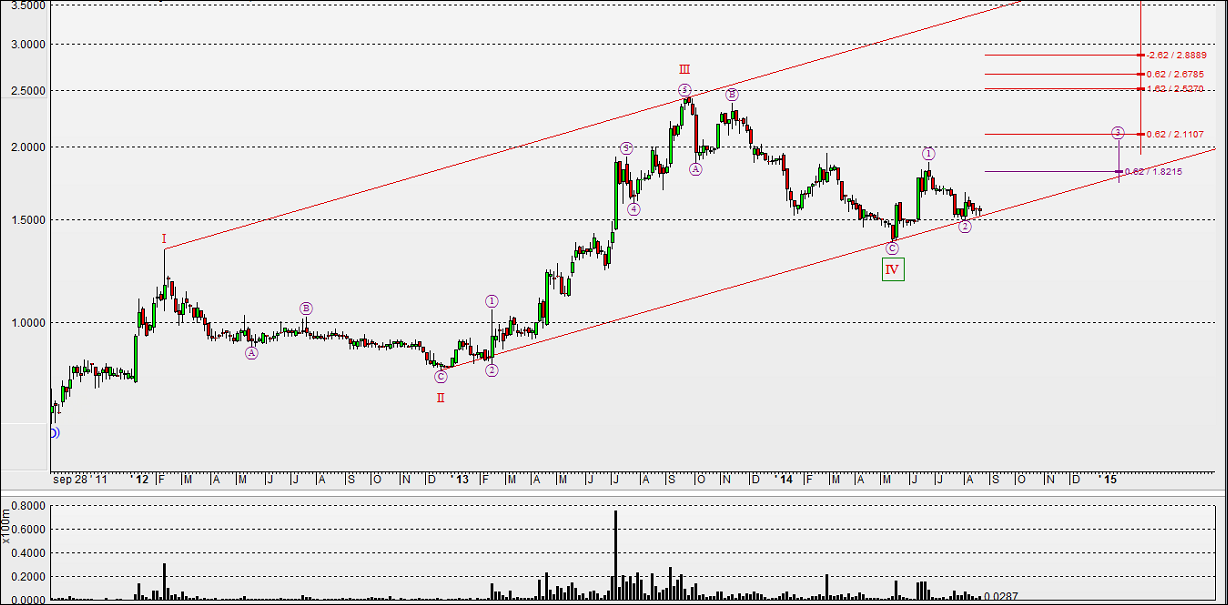
1st scenarios
We study the main trend is impulse 2, which is wave 4 is retrace maximize 62% but not overlap wave 1


I am used Fibonacci  ext to draw the potential reversal zone, basically all the key point is related to 61.8%, 76%, 100% and 161.8 % of the recent wave 1 and 2 retracement .
those key level in price is RM 1.82, 1.90, 2.05 and 2.48.
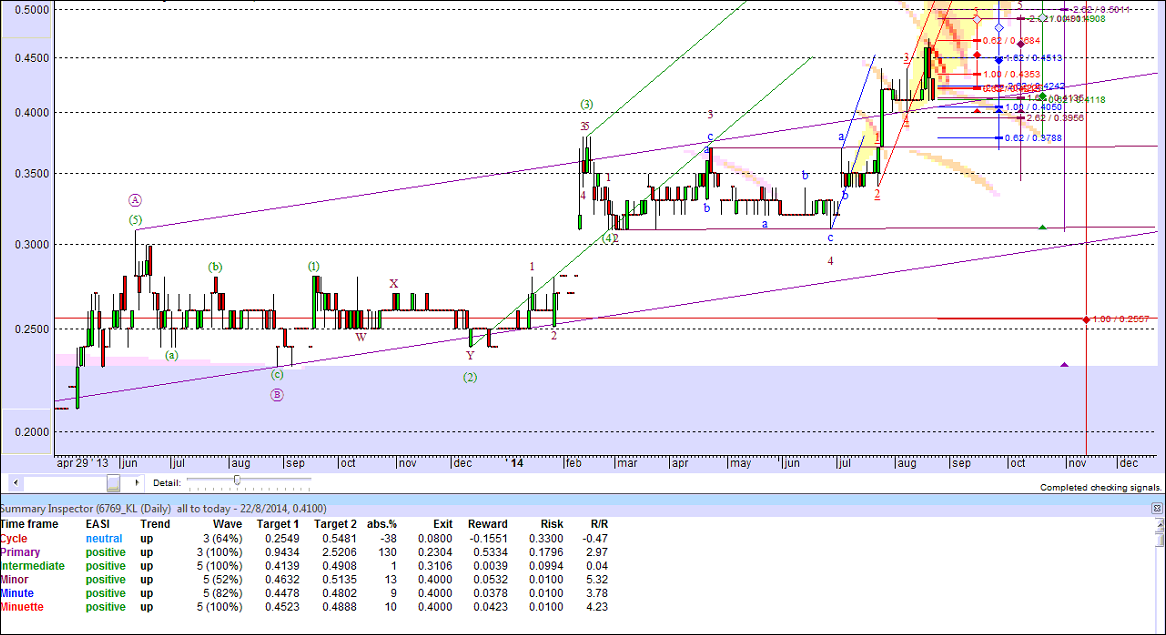
2nd scenarios
The primary wave degree is Zig Zag Flat, this pattern has been defined as a sharp Corrective Pattern, which is hybrid of a ZZ, the wave B was ended and started with  C downtrend, but when we zoom it down to the smaller wave degree it is a uptrend with wave 2( abc uptrend blue colot dot).it is okay if you don't get it..
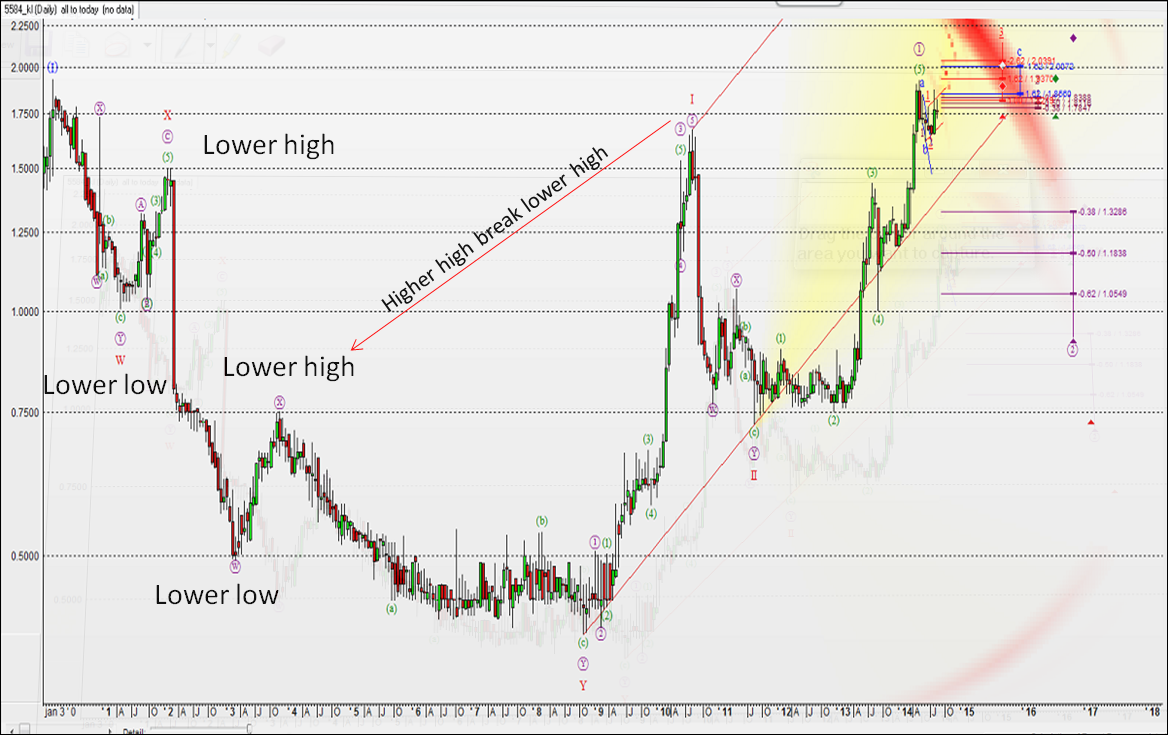


3rd scenarios
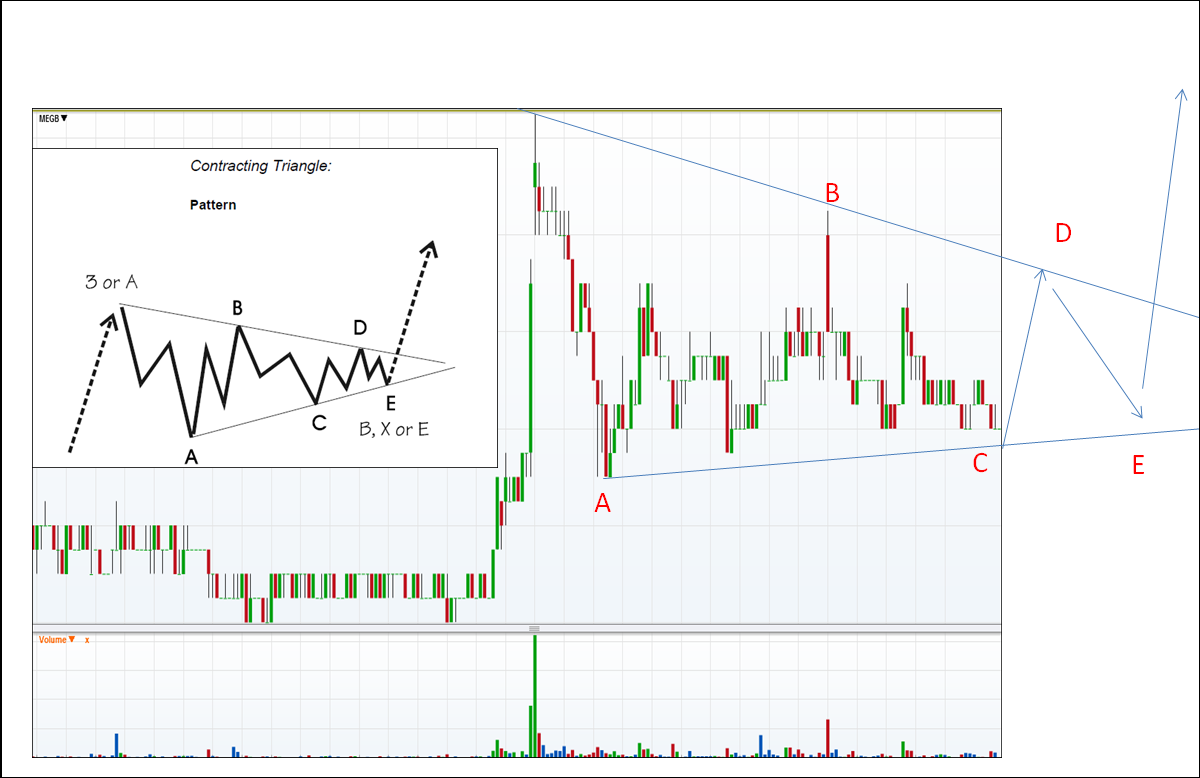
The super cycle(WXY) and cycle(WXY) is double ZZ.
Blue Color label supercycle


Red color label indicate Cycle


Zoom down to smaller wave degree which is Primary wave, which is ZZ flat and wave is under development and the target for the TP of this wave degree is 2.05 and 2.24
Add caption


In summary
when prices action go to that level I mention  and we got to observe volume vs prices movement...  I will update my action for next post when come to Tuesday and Wednesday .
1 Key level
1.80
1.92
2.05
2.24
2.48
If I am long term  trader.. I may consider to  hold till RM 4.70.

Breaking News : Stand a chance to win an Ipad Air when you like us on our facebook page and join us to become our member by filling the membership form at the bottom, you will receive latest updates from us through email , facebook and also being added into our investment education Telegram group !

DISCLAIMER:

Stock analysis and comments presented on klseelwavetrading.blogspot.com are solely for education purpose only. They do not represent the opinions of klseelwavetrading.blogspot.com on whether to buy, sell or hold shares of a particular stock.
Investors should be cautious about any and all stock recommendations and should consider the source of any advice on stock selection. Various factors, including personal or corporate ownership, may influence or factor into an expert's stock analysis or opinion.
All investors are advised to conduct their own independent research into individual stocks before making a purchase decision. In addition, investors are advised that past stock performance is no guarantee of future price appreciation.

Saturday, August 30, 2014

When and which target should I take profit through unfold every wave degree of KPS Part I

http://klseelwavetrading.blogspot.com/2014/08/three-reason-why-i-invest-on-kps.html

As a successful  speculator, trader or investor in financial market, one of the key success factor is able to identify trend either is impulse or correction, base on your study and need to draft a trading plan than trade your plan according it... remember market is always correct and you got to admit it if the trend is again you. cut the lost if hit the Stop point ... Take your Profit when market show a early signal if the it still not hit you plan TP area.
Pls refer to the chart below is the KPS which bought some lots average at RM 1.54 and now moving to my flavor direction, the next question I had in my mind is
1. Need to have plan to protect my profit.
2. How to optimized my profit.

Step 1
Identify main trend, looking the chart below, the pattern has been defined as a TREND pattern in which wave 4 is allowed maximum retrace 62%, without overlapping wave 1.

wave 1 is unknown pattern, but we can see it have 3 wave up trend and I could just name it impulse wave1
wave 2 is Zig Zag
wave 3 is impulse wave
wave 4 is double Zig zag or we name it as a W,X,Y


Step 2
Unfold all the wave in too smaller degree, sometime you may not able to identify certain wave, and that is normal. let take look closer to the chart

Wave 1
Can you see a 3 wave degree up ? which I don't label it and it a test for you to see.. :-)


Wave 2
ABC, Zig Zag, you can see the wave C is Extension 3


Wave 3 

The most excited wave, if you manage to ride it and you can make handsome money.
We can see it is extension wave, 2 impulse wave in the wave 3 uptrend, sometime have 3 impulse wave.


Wave 4


which is double ZZ or WXY and we can see that is many small correction wave and impulse wave ...
W is Zig Zag Flat
X is  Zig Zag
Y is  Zig Zag


Step 3
Wave 5 is under development and most excited wave which is involve TP, secure profit and Maximize it.. I will more time to analyzed it... too be continue in part II


Breaking News : Stand a chance to win an Ipad Air when you like us on our facebook page and join us to become our member by filling the membership form at the bottom, you will receive latest updates from us through email , facebook and also being added into our investment education Telegram group !

DISCLAIMER:

Stock analysis and comments presented on klseelwavetrading.blogspot.com are solely for education purpose only. They do not represent the opinions of klseelwavetrading.blogspot.com on whether to buy, sell or hold shares of a particular stock.
Investors should be cautious about any and all stock recommendations and should consider the source of any advice on stock selection. Various factors, including personal or corporate ownership, may influence or factor into an expert's stock analysis or opinion.
All investors are advised to conduct their own independent research into individual stocks before making a purchase decision. In addition, investors are advised that past stock performance is no guarantee of future price appreciation.

Thursday, August 28, 2014

Trading Tips: 10 Things A Trader Needs To Give Up... for my own reference


We are so focused on adding to our trading arsenal with knowledge, books, chart patterns, indicators, moving averages, gurus, things for our watch list and whatever else we believe will help us make money that we forget what to give up on. One of the biggest things that determines whether a new trader ends up being a winning trader is how well they can filter out things that do not help them make money.
As traders, we cannot follow every indicator, trade every method, and endlessly add to your trading methodology, you have to make choices and you have to know what does not help you make money and what to delete. A trader has to identify things that they are doing that cause them to lose money and then give up those habits.
  • Give up your need to be right. The market is always right, do not strive to be right in your predictions and opinions, strive to go with the flow of the market.
  • Give up control. No matter how long you watch a live stock stream you have zero power over the movements. Save your emotional energy by not trying to cheer on your positions and get wrapped up in every price tick.
  • Give up blaming “They” for your losses. There is no mysterious ‘They’ causing you to lose money, your choices cause you to lose money or your system just had a losing trade. You can be on the same side as ‘They’ if you traded differently. It is a free country and free market.
  • Give up beating yourself up for losing trades. If you followed your trading plan then there should be zero regrets involved in a losing trade. If you did not follow your plan and lost then your money was your tuition, you paid your price so mentally and emotionally move on to the next trade.
  • Give up your own opinions. If you took a trade based on your own opinion you have to give up your opinion and get out if the trade moves to a place that proves you were wrong.
  • Give up your inability to change your mind. The more you believe a trade just can’t miss the more dangerous it is. It will cause you to trade too big and stay in too long. You have to always be ready to be wrong.
  • Give up your past trades. Each trade is a new trade do not hold grudges against stocks and think they ‘owe’ you for past losses. Do not fall in love with a stock and hold it as it falls lower and lower.
  • Give up letting your trading define your self worth. Do not let your trading define you. Diversify your life with friends, family, hobbies, and other interests. It is not healthy to become overly obsessed with the markets.
  • Give up on losing trades quickly when your stop is hit. Your best trades will be the ones that are profitable from the start, if they immediately go against you be prepared to be stopped out. You can destroy your trading account when you start the “It will come back, I just have to wait” chant in the midst of a death spiral.
  • Give up on price targets let your winners run as far as they will go. In the right market conditions trends can go on to unbelievable levels, the big wins during these trends can make your entire career. If you set a predefined profit target you will miss the opportunity when it comes. Let a trailing stop take you out.
Instead of giving up on the markets, give up on these bad habits.
Twitter: @SJosephBurns  
This previously appeared on the NewTraderU.  
Any opinions expressed herein are solely those of the author, and do not in any way represent the views or opinions of any other person or entity.
source:  http://www.seeitmarket.com/trading-tips-10-things-trader-needs-give-up-13740/

Breaking News : Stand a chance to win an Ipad Air when you like us on our facebook page and join us to become our member by filling the membership form at the bottom, you will receive latest updates from us through email , facebook and also being added into our investment education whatapps group !


DISCLAIMER:

Stock analysis and comments presented on klseelwavetrading.blogspot.com are solely for education purpose only. They do not represent the opinions of klseelwavetrading.blogspot.com on whether to buy, sell or hold shares of a particular stock.
Investors should be cautious about any and all stock recommendations and should consider the source of any advice on stock selection. Various factors, including personal or corporate ownership, may influence or factor into an expert's stock analysis or opinion.
All investors are advised to conduct their own independent research into individual stocks before making a purchase decision. In addition, investors are advised that past stock performance is no guarantee of future price appreciation.


7374.KL Picking up wave 4 reversal up !!!

Pls Refer the chart below, now there are 4 consecutive wave degrees in a down trend that have a probability of completing waves 5 . For picking a bottom this is a first alert, but be careful. The more patterns of different wave degrees show 5 waves that are completing, the higher the probability that a major reversal is just around the corner.
This is an early warning so prices could still decline further if the patterns extend, check other
indications of an ending trend as well.

Overall trend is Extension 3, this pattern has been defined as a trend pattern in which wave 3 is extended. it is the most probable trend pattern to occur, very often wave 1 is equal to wave 5 in time and prices when  a 3rd wave is extend,

the current wave state is end of wave 4(WXY,), normally the minimum retrace of the 4th wave is 23% and mostly is 38.2%, but this retracement is less than that,  if this is really such a small 4th wave retrace, get ready for an acceleration.

Action : Look for support level or optimum level to buy
Stop lost " 2 candle close below Rm 2.10
TP : 1st RM 2.43, 2nd Tp is RM 2.56 and 3rd Tp is RM2.65


Breaking News : Stand a chance to win an Ipad Air when you like us on our facebook page and join us to become our member by filling the membership form at the bottom, you will receive latest updates from us through email , facebook and also being added into our investment education Telegram group !


DISCLAIMER:

Stock analysis and comments presented on klseelwavetrading.blogspot.com are solely for education purpose only. They do not represent the opinions of klseelwavetrading.blogspot.com on whether to buy, sell or hold shares of a particular stock.
Investors should be cautious about any and all stock recommendations and should consider the source of any advice on stock selection. Various factors, including personal or corporate ownership, may influence or factor into an expert's stock analysis or opinion.
All investors are advised to conduct their own independent research into individual stocks before making a purchase decision. In addition, investors are advised that past stock performance is no guarantee of future price appreciation.

Wednesday, August 27, 2014

Sealink buy opportunity @ wave 4 potential reversal zone

I am in Elliot wave trading method about 4 years, one of the wave degree is most comfortable to trade is to look for the wave 4 correction wave end, because the impulse 3 and 5 wave is very profitable and wave 5 is most easy to recognize,  risk to reward is good deal as well
let look at the chart below it is very clear , this counter is have impulse wave uptrend and just completed wave 4 correction wave. this wave 4 correction normaly decouple with internal news and will release good news to push for wave 5 impulse wvae up
The trade will be 0.490 Cut lost with consecutive 1st TP on 0.60 and 2nd TP 0.625 and last will be 0.70... Good Luck !


Breaking News : Stand a chance to win an Ipad Air when you like us on our facebook page and join us to become our member by filling the membership form at the bottom, you will receive latest updates from us through email , facebook and also being added into our investment education Telegram group !


DISCLAIMER:

Stock analysis and comments presented on klseelwavetrading.blogspot.com are solely for education purpose only. They do not represent the opinions of klseelwavetrading.blogspot.com on whether to buy, sell or hold shares of a particular stock.
Investors should be cautious about any and all stock recommendations and should consider the source of any advice on stock selection. Various factors, including personal or corporate ownership, may influence or factor into an expert's stock analysis or opinion.
All investors are advised to conduct their own independent research into individual stocks before making a purchase decision. In addition, investors are advised that past stock performance is no guarantee of future price appreciation.

Tuesday, August 26, 2014

MEGB is getting excited !!! ... anytime it will breakoff !!! the question is up or down ?

I was in this trade about 1 weeks plus and typical I am holding a stock less than a month for short term trade and mid to long term will be 6 month and less than 2 years... given the world situation now and base on inter-market analysis I did on gold, bond, high/low yield currency, commodity and lastly stock... long term hold is not a good choice.
back to MEGB... pls look at the big picture, refer to the post I make, MEGB downtrend is ended
 http://klseelwavetrading.blogspot.com/2014/08/megb-is-time-to-take-off.html
 The question is when it will another spike up ? I did second level analysis, refer to the chart below, New CEO appointed and stimulated market move(wave 3) and make another confirmation to validate the recent ABC down is correction wave.
 Daily Chart


1 Hour chart.
let zoom down to smaller wave degree . you can see an contracting triangle was formed and it is corrective pattern and it compose of 5 wave, each of them had a corrective nature .Triangles occur only in waves B, X and 4. Never in wave 2 or A.


The question of the contracting triangle can be spike up or down, it is like sword have 2 side :-) .


Base on the combination of the Elliot Wave study... the spike up probability is higher and let wait and see what will be happen


let talk about Real trading .. by knowing the information in hand... tell me what is your take ? pls remember trading is consist of money management, TA , FA and emotion control... let we walk through the journey together to be successful trader in KLSE, FX and etc...


Breaking News : Stand a chance to win an Ipad Air when you like us on our facebook page and join us to become our member by filling the membership form at the bottom, you will receive latest updates from us through email , facebook and also being added into our investment education Telegram group !


DISCLAIMER:

Stock analysis and comments presented on klseelwavetrading.blogspot.com are solely for education purpose only. They do not represent the opinions of klseelwavetrading.blogspot.com on whether to buy, sell or hold shares of a particular stock.
Investors should be cautious about any and all stock recommendations and should consider the source of any advice on stock selection. Various factors, including personal or corporate ownership, may influence or factor into an expert's stock analysis or opinion.
All investors are advised to conduct their own independent research into individual stocks before making a purchase decision. In addition, investors are advised that past stock performance is no guarantee of future price appreciation.


Daya Rebound back to 0.335 ?

I personally committed a trade at 0.310 on last Thursday before the Daya suspended and released news to raising fund and expand the business. The trend from 2011 till today is bullish and showed it is impulse wave and just complete correction wave (a,b,c)and form wave 4 , it can be further confirm by the recent move which is the smaller wave (1) was touch the wave (b), this indicate the recent move down is correction wave and should not go below wave c(0.280)
The question now is what should I do next with this information in hand... I have 2 scenario...
1.) if I not buy any and I will go in as small lot with TP at 0.335 to 0.355...
2.) if I already have unit in hand I will hold it...
I guess people may had question why TP at 0.335 to 0.355?  I did asses the wave is diagonal wave 1 and the next move is wave 3 and the consecutive target is 0.33 to 0.35.
Nothing is perfect ... I like to remind myself, trading is deal with probability game and it can be wrong and perfectly fine is I am wrong ... I will cut my lost if the price close below 0.28...


Breaking News : Stand a chance to win an Ipad Air when you like us on our facebook page and join us to become our member by filling the membership form at the bottom, you will receive latest updates from us through email , facebook and also being added into our investment education Telegram group !


DISCLAIMER:

Stock analysis and comments presented on klseelwavetrading.blogspot.com are solely for education purpose only. They do not represent the opinions of klseelwavetrading.blogspot.com on whether to buy, sell or hold shares of a particular stock.
Investors should be cautious about any and all stock recommendations and should consider the source of any advice on stock selection. Various factors, including personal or corporate ownership, may influence or factor into an expert's stock analysis or opinion.
All investors are advised to conduct their own independent research into individual stocks before making a purchase decision. In addition, investors are advised that past stock performance is no guarantee of future price appreciation.

Monday, August 25, 2014

Three reason why I invest on KPS

What is 360 degree analysis??? 1st 120 degree is News, follow by 240 degree is fundamental analysis and last but not least is Technical analysis.

let we talk about the 1st 120 degree which is news, given the fast is Selangor Gov going to consolidate all the water biz...puncak niaga.. splash and etc... KPS was owned 30% share of splash, the existing deal is not reasonable given to splash and I believed better deal is coming to splash, hence  KPS should have a good revenue after good deal done...

follow by 240 degree analysis ... KPS is hold by all the big MAN


Pls look at the Earning per share also good.... which is 0.93...


Lastly 360 degree is Technical analysis, look at the chart below and we can see very cleat wave I, II, III and IV just ended with correction wave A, B and C
Now is wave 5 uptrend is just started smaller wave degree, which is 1, 2 is ended and wave 3 is started...that is couple of TP stated in the chart. the most conservative target is RM 1.82, follow by RM 2.1 , RM 2.5 , RM 2.7 and RM 2.9.

on top of the Elliot WAVE. we can see the Head and shoulder formation as well, which is provide clear entry point of the right shoulder support line, which is RM 1.53. today close at this support point and personally I bought 10,000 share.  the cut lost point is close below RM 1.30, which is rarely happen.

 Typically wave 4 is have a sign of news release wave to boost wave 5... What are you waiting for ?
Again ... we are deal with the probability game and nothing is 100% and trade on yours own risk...


Breaking News : Stand a chance to win an Ipad Air when you like us on our facebook page and join us to become our member by filling the membership form at the bottom, you will receive latest updates from us through email , facebook and also being added into our investment education Telegram group !


DISCLAIMER:

Stock analysis and comments presented on klseelwavetrading.blogspot.com are solely for education purpose only. They do not represent the opinions of klseelwavetrading.blogspot.com on whether to buy, sell or hold shares of a particular stock.
Investors should be cautious about any and all stock recommendations and should consider the source of any advice on stock selection. Various factors, including personal or corporate ownership, may influence or factor into an expert's stock analysis or opinion.
All investors are advised to conduct their own independent research into individual stocks before making a purchase decision. In addition, investors are advised that past stock performance is no guarantee of future price appreciation.

Sunday, August 24, 2014

Watch out !!! Major Reversal is coming - Keladi Maju Behad


Now there are 4 consecutive wave degrees in an uptrend that have a probability of completing
five waves! For picking a top this is an important alert, but be careful.
The more patterns of different wave degrees show 5 waves that are completing,
the higher the probability that a major reversal is just around the corner.
This is an early warning so prices could still rise further if the patterns extend, check other
indications of an ending trend as well. Active traders should focus on smaller
wave degrees starting from Minor or minute. The summary inspector will give its first indications
when the smallest wave degrees (at the bottom) change to negative.
The target is the area of the previous 4th wave, normally the extreme of this 4th wave will be reached.
------------------------------------------------
Action      : Short/sell
Applies to        : Institutional traders

1st Wave degree  :Intermediate
% signals wave 3  :0
% signals wave 4  :0
% signals wave 5  :100
2nd Wave degree  :Minor
% signals wave 3  :36.2731
% signals wave 4  :11.3798
% signals wave 5  :52.3471
3rd Wave degree  :Minute
% signals wave 3  :2.7624
% signals wave 4  :14.7330
% signals wave 5  :82.5046
4th Wave degree  :Minuette
% signals wave 3  :0
% signals wave 4  :0
% signals wave 5  :100


Breaking News : Stand a chance to win an Ipad Air when you like us on our facebook page and join us to become our member by filling the membership form at the bottom, you will receive latest updates from us through email , facebook and also being added into our investment education Telegram group !


DISCLAIMER:

Stock analysis and comments presented on klseelwavetrading.blogspot.com are solely for education purpose only. They do not represent the opinions of klseelwavetrading.blogspot.com on whether to buy, sell or hold shares of a particular stock.
Investors should be cautious about any and all stock recommendations and should consider the source of any advice on stock selection. Various factors, including personal or corporate ownership, may influence or factor into an expert's stock analysis or opinion.
All investors are advised to conduct their own independent research into individual stocks before making a purchase decision. In addition, investors are advised that past stock performance is no guarantee of future price appreciation.

MEGB is time to take off ?

In bigger picture MEGB, the downtrend was ended with the spike up(news announce Gary How wanted to buy 600,000 share with RM1.1) which were break the lower high and stopped the lower low formation.

In Daily outlook, wave 2 was ended with double ZZ,  wave 3 is just started with the prices action break the latest lower high(Arrow pointed to wave 3 higher than wave b) right after new CEO appointed to Gary how, prices now rest on the 0.415 support line, which is the best area to buy in... I was in average price on 0.430... expected the prices will pick up in this two week time.  target price is 0.51...

Why we used technical analysis in stock market, future , forex market and etc... ?one of the reason is because the chart formation of each counters will have similar(not 100% match) characteristic and will repeat and repeat ... 

Refer to the technical chart below is the Yee Lee Corporation berhad technical chart, that is the spike up(wave 1 red front) was breaking the recent lower high. It is similar to the MEGB spike up after recent announcement ( RM 1.1 option price…). It clearly tell us the down trend is over and wave 1 up trend confirm


Pls look at the second chart, I put MEGB chart on the Yee LEE chart with the red box indication . it try to tell us where we(MEGB) are??? As I mention , wave 2 ended with double ZZ(WXY), both MEGB and Yee Lee have similar signature…
What happen next after the wave 2 down trend consolidation ? You can see by you eye on Yee Lee Chart … some one ask what is the next price will be? Look at what is the latest prices ?
Again we can said the past history may not represent the future results!!! That is absolute truth … we got to know trading we are deal with the probability game … we have high % of winning compare to betting on the big small.

Good luck every one … trade base on what you affordable to commit...

Pls left question and comment !!! I willing to spend time to answer the question you had and we can learn technical trading together... important is the post I make is in "real time" meaning is prices is not yet move...

Follow the blog and learn together... feel free to put fundamental analysis by respond to the blog


Breaking News : Stand a chance to win an Ipad Air when you like us on our facebook page and join us to become our member by filling the membership form at the bottom, you will receive latest updates from us through email , facebook and also being added into our investment education Telegram group !


DISCLAIMER:

Stock analysis and comments presented on klseelwavetrading.blogspot.com are solely for education purpose only. They do not represent the opinions of klseelwavetrading.blogspot.com on whether to buy, sell or hold shares of a particular stock.
Investors should be cautious about any and all stock recommendations and should consider the source of any advice on stock selection. Various factors, including personal or corporate ownership, may influence or factor into an expert's stock analysis or opinion.
All investors are advised to conduct their own independent research into individual stocks before making a purchase decision. In addition, investors are advised that past stock performance is no guarantee of future price appreciation.


Saturday, August 23, 2014

Time to buy TROPICANA CORPORATION BERHAD ?

looking at the big picture (trend from 2000 till 2014)below , This counter will attract investor because it is wave 3 in cycle wave and wave 2 in primary wave ending soon and starting with wave 3.

Let zoom down to smaller wave degree(2013 till today) which is form minor, minute and minute ... it showing downtrend which is very bearish, normally this type of trend will scare away majority of the stoke retail trader, but it is clearly show the short term downtrend is almost end with the 4 consecutive wave 5th and the major reversal is coming. We got to check other indicator to validate the down trend is end.
Now is the best time to jump in to this counter ? my answer is yes or wait for the smaller wave deg to turn positive.
The risk to reward is worth with it. The Cut lost point is the price drop and close below RM1.4 and the 1st TP will be RM1.8/2.00 and second TP will be RM3.3/3.4.
Active traders should focus on smaller wave degrees starting from Minor or minute. The summary inspector will give its first indications when the smallest wave degrees (at the bottom) change to positive.


Breaking News : Stand a chance to win an Ipad Air when you like us on our facebook page and join us to become our member by filling the membership form at the bottom, you will receive latest updates from us through email , facebook and also being added into our investment education Telegram group !


DISCLAIMER:

Stock analysis and comments presented on klseelwavetrading.blogspot.com are solely for education purpose only. They do not represent the opinions of klseelwavetrading.blogspot.com on whether to buy, sell or hold shares of a particular stock.
Investors should be cautious about any and all stock recommendations and should consider the source of any advice on stock selection. Various factors, including personal or corporate ownership, may influence or factor into an expert's stock analysis or opinion.
All investors are advised to conduct their own independent research into individual stocks before making a purchase decision. In addition, investors are advised that past stock performance is no guarantee of future price appreciation.

Thursday, August 21, 2014

Now is the Time to Buy DAYA

Looking at the chart below, the long term trend wave 2 is over and wave 3 going to start...

We zoom down to small wave degree, the recent move was complete with impulse up 1,2,3,4 and 5 (A)with the correction ABC(B) just end and now should be moving toward wave C

The next question is how much is the target ? the projection for the 1st consecutive target is 0.36 and target 2 is 0.40.

The best I like it the FORCE selling is over and now is the time to accumulated the stock ... throw it to me if you don't want !!!


Breaking News : Stand a chance to win an Ipad Air when you like us on our facebook page and join us to become our member by filling the membership form at the bottom, you will receive latest updates from us through email , facebook and also being added into our investment education Telegram group !


DISCLAIMER:

Stock analysis and comments presented on klseelwavetrading.blogspot.com are solely for education purpose only. They do not represent the opinions of klseelwavetrading.blogspot.com on whether to buy, sell or hold shares of a particular stock.
Investors should be cautious about any and all stock recommendations and should consider the source of any advice on stock selection. Various factors, including personal or corporate ownership, may influence or factor into an expert's stock analysis or opinion.
All investors are advised to conduct their own independent research into individual stocks before making a purchase decision. In addition, investors are advised that past stock performance is no guarantee of future price appreciation.

Wednesday, August 20, 2014

SUMATEC Will Heading to what Level ?


As I posted the Sumatec will be reverse soon due to the prices level was reach wave 5th of the 5th, typical trend reach such level will lost momentum to clamp to new high. Today truth enough the prices was retrace up to 30%, properly the next question how far the price can go before it goes next move. the picture below is show the potential retracement prices may go down to 0.3650- 0.3350.

Previous post http://klse.i3investor.com/blogs/SUMATEC_BEAR/58019.jsp 


Breaking News : Stand a chance to win an Ipad Air when you like us on our facebook page and join us to become our member by filling the membership form at the bottom, you will receive latest updates from us through email , facebook and also being added into our investment education Telegram group !


DISCLAIMER:

Stock analysis and comments presented on klseelwavetrading.blogspot.com are solely for education purpose only. They do not represent the opinions of klseelwavetrading.blogspot.com on whether to buy, sell or hold shares of a particular stock.
Investors should be cautious about any and all stock recommendations and should consider the source of any advice on stock selection. Various factors, including personal or corporate ownership, may influence or factor into an expert's stock analysis or opinion.
All investors are advised to conduct their own independent research into individual stocks before making a purchase decision. In addition, investors are advised that past stock performance is no guarantee of future price appreciation.