Breaking News : Likes our facebook page and join us as members, you will receive email updates and instant updates in Telegram group.
Breaking News : Likes our facebook page and join us as members, you will receive email updates and instant updates in Telegram group.
Weekly Chart
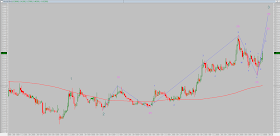
In nutshell, Hovid is in 3 consecutive impulse waves degree which is pointing to uptrend, they are wave 3(long term),5(med Term),3( short Term).I guess it is not a new method to analysed a stock by using 3 time frame, which is Long , med and short term. Most of the time, I am committing to buy a stock when 3 time frames is agreed to each other to pointing to same direction, occasionally I will buy when 2 were agreed...
Chart fig 1 below show
1.) Green color wave is Long term trend, wave 3 development is on going, typical wave 3 is the longest and strongest wave compare to other waves, wave 3 is most preferable wave degree wish to ride by Elliot wave riders
2.) Magenta Color is Med term, Wave (4) was ended with short term wave, which wxyxz, this means wave (5) was kick start. which is moving toward 0.510/0.570
3.) Blue color is short term and wave 3 development is ongoing, you may not see it!!! because it is short term wave degree, you may not see it in the weekly chart, hence we need unfold it in daily chart.
 |
| Fig 1 |
Daily Chart
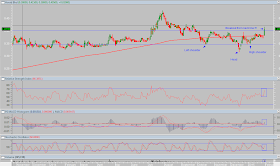
I used couple type of analysis method apply on Hovid, I hope to share my Technical point of view, how this stock transition from downtrend to side-way, than follow by being mark up...Chart fig 2 shown the downtrend channel was violated, it is an indication of down trend ending.
 |
| Fig 2 |
1.) We do see 4 months long consolidation started on Oct till Jan to form and rectangle box , it is an indication of stock being accumulated by strong holder and prepared for next action.
2.) That is shake out activities happen on 16/17 Dec, this time is typical stock transition from weak holder to strong holder, it could either is panic selling or spring test by smart money to shake out seller...
3.)Breakout happen started on last Friday (30/Jan), the break out is changing market stage from 1( 4 months accumulation activities) to stage 2( Market make up). the breakout candle is long white candle with massive volume, which means it is solid breakout
4.) RSI, MACD and Stochastic is all agree the stock bull ran is just started
 |
| Fig 3 |
Chart Fig 4
Formed bullish inverted head and shoulder, Neck line at 0.405 and just breakout on last Friday. White candle with Massive volume, it is show very bullish signal
 |
| Fig 4 |
Chart Fig 5 show Support and Resistance
 |
| Fig 5 |
Support 2: 0.365/0.370
Support 3: 0.345.
Resistance 1 : 0.425
Resistance 2 : 0.440
Resistance 3 : 0.460
Resistance 4 : 0.480
Chart Fig 6 show Wave 3 and Wave 5 Target prices
 |
| Fig 6 |
Chart Fig 7 show weekly Chart
 |
| Fig 7 |
Target 1 : 0.510
Target 2 : 0.570
Summary of Bullish Technical Justification
1.) Elliot wave analysis showed 3(Long, Med and short term) consecutive waves degree pointing uptrend, which is a very bullish implication.2.) Stage 1 accumulation ended on Friday(30/Jan) with break out !!! break out with long white candle with massive volume
3.) Inverted head and shoulder formed, Neck line break out !!!
4.) RSI, MACD and Stochastic all agreed to the prices action, which is uptrend.
My Trade plan
1.) I will scale in during open market given the fact is very bullish implication2.) I will collect it on weakness if it prices go down to Support 1 : 0.400/0.395 and Support 2: 0.365/0.370
Stop loss
I will Cut my position if the prices drop below 0.340.My Profit Target
Price at those Target or Resistance point/zoneTrailing Stop
I will apply trailing stop after target reached or price break above the resistance to protect my profit.Resistance 1 : 0.425
Resistance 2 : 0.440
Resistance 3 : 0.460
Resistance 4 : 0.480
(Free OF charge) Please register for KLSE Technical analysis on Feb 3, 2015 9:00 PM SGT at:
https://attendee.gotowebinar.com/register/7846691484159716354
Agenda
1.) KLSE CI Index outlook
2.) MY Stock pick
After registering, you will receive a confirmation email containing information about joining the webinar.
Trading Challenge
Many people committed to buy stock is very easy, when come to profit taking and cut loss is one of the most difficult part in trading world, talking about profit taking is dealing with greed and stop loss is dealing with fear, cutting loss is a must in trading world because it stopping my capital continue to loss, in order to stay alive in trading world... it is a must !!! it is not an option, else I suggest you get out of the trading and you are not suitable.
I wanted to used simple example to share on the cut loss ... you bought an egg and prepare to used it for fry rice, some how you notice/suspect the eggs you pick was/may turn bad.... the question now is shall out throw/scrap the bad one and pick another .... or nevermind bet or hope the suspicious "bad" egg will be good and risk the good rice which is ready to cook ? you make the call... I am believed in order to win I got to know how to prevent I am loss in the market... if I notice I am wrong... I got to admit and cut the loss and make a next move.
As a reminder for myself
I am always remind myself If the trend is go again me and violated my SL limit, I will cut loss base on the risk preference.
Stop Loss is painful process because I making loss, but it is necessary to take it, it is very important because it protect my capital to ensure I am stay in the market.
DISCLAIMER:
Stock analysis and comments presented on klseelwavetrading.blogspot.com are solely for education purpose only. They do not represent the opinions of klseelwavetrading.blogspot.com on whether to buy, sell or hold shares of a particular stock.
Investors should be cautious about any and all stock recommendations and should consider the source of any advice on stock selection. Various factors, including personal or corporate ownership, may influence or factor into an expert's stock analysis or opinion.
All investors are advised to conduct their own independent research into individual stocks before making a purchase decision. In addition, investors are advised that past stock performance is no guarantee of future price appreciation.
All investors are advised to conduct their own independent research into individual stocks before making a purchase decision. In addition, investors are advised that past stock performance is no guarantee of future price appreciation.


No comments:
Post a Comment