Sunday, October 4, 2015

Opcom: Multiple Technical Indicator Trigger bullish signal !!!

Executive Summary

Opcom seeked bottom at $ 0.55 and trending side-way as of now, it should trading toward bullish trend and may start very soon, the statement I make were supported by technical and Fundamental justification. I was committed at $0.750-$0.760 on 1st/OCT/2015 and I am anticipated most probability it will breakaway from immediate resistance at $0.815 and move to target of $0.970/$1.14 in 4-8 weeks period of time. Traders may make trade along the wave up and benefited on the upcoming move, I will lock partial profit and apply trailing stop along the resistance line @ $0.815/$0.900/$0.970/$1.05. Immediate support at $0.730, Strong support at $0.720/$0.690. Stop loss if trade below $0.660.


Technical Justification( Pattern, Harmonic and Elliott wave trading)

1. Forming Cup and Handler, Probability of breakout away from $0.815 is high chance, which will promote more buyers commit to the trade as Cup and Handler Breakout target is $0.970


2. Flag Pole was formed on 15th of Sept with substantial volume kicked in, consolidate was taken placed for two week which was formed Flag(pattern trading) or ABC Zig Zag(Elliott wave), Friday was breakaway from the Flag formation , it is indicate correction was ended, impulse wave kick in which will motive more traders to commit to the trade which may breakaway from $0.815 and move to target $ 0.975/$1.12.


3. Formed Shark pattered and found bottom at $0.550(ABC), to complete the pattern price will reach at $0.900/$1.10 and $1.30

4. Volume profile overlay show trade below 70% distribution range, which means accumulation ongoing, once it trade above $0.870, it will pulling attention and I do expect price and volume more retail will participate and price show fast accelerated which may good time to lock profit.


5.Triangle formation, now trade within triangle.I am anticipate it should breakaway from it
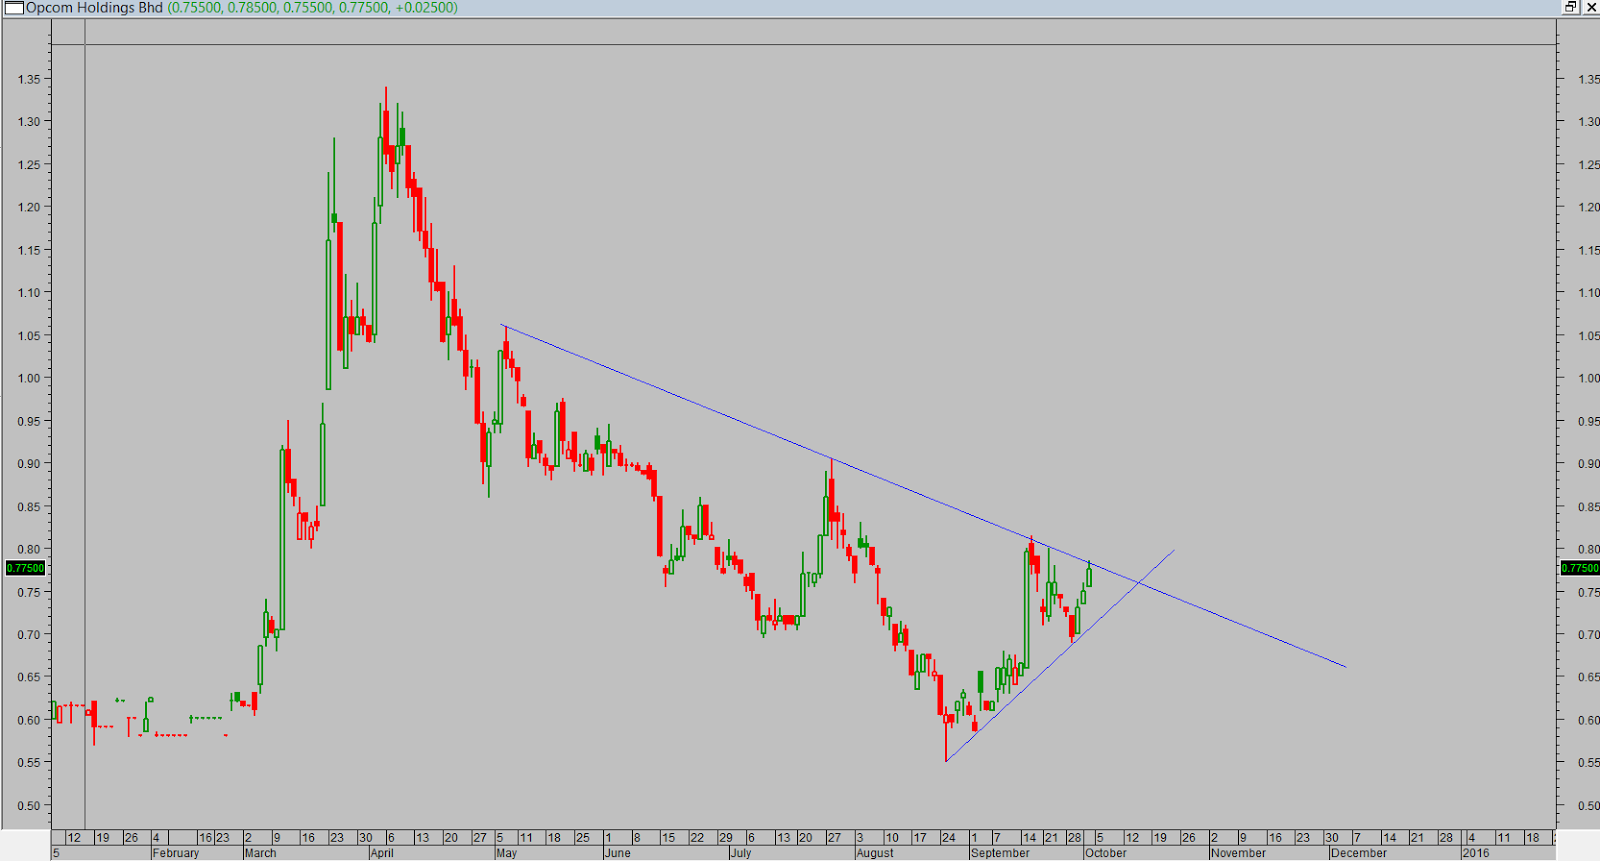


6. Wave 2 ended with correction c and wave 3 is kick in and heading to $1.00

Technical Justification(Indicator)

1. RSI rebound above 50, it carry bullish implication.
2. MACD kiss and rebound up above 0
3. Stochastic Oscillator cross up
4. Trade with in High Volume candle and it is under consolidate for next big move


5. Price trade above 5,10 and 20 moving average, it indicate bullish trend and most probably will trade above 50 MA very soon.

6. Up push candle getting easy, it is indicate supply is getting thinner, it is good sign move the stock up from low.


For Instant update may join Telegram group by click the link below

Trading Challenge

Many people committed to buy stock is very easy, when come to profit taking and cut loss is one of the most difficult part in trading world, talking about profit taking is dealing with greed and stop loss is dealing with fear, cutting loss is a must in trading world because it stopping my capital continue to loss, in order to stay alive in trading world... it is a must !!! it is not an option, else I suggest you get out of the trading and you are not suitable.

I wanted to used simple example to share on the cut loss ... you bought an egg and prepare to  used it for fry rice, some how you notice/suspect the eggs you pick was/may turn bad.... the question now is shall out throw/scrap the bad one and pick another .... or nevermind bet or hope the suspicious "bad" egg will be good and risk the good rice which is ready to cook ? you make the call... I am believed in order to win I got to know how to prevent I am loss in the market... if I notice I am wrong... I got to admit and cut the loss and make a next move.


As a reminder for myself
I am always remind myself If the trend is go again me and violated my SL limit, I will cut loss base on the risk preference.
Stop Loss is painful process because I making loss, but it is necessary to take it, it is very important because it protect my capital to ensure I am stay in the market.

DISCLAIMER:
Stock analysis and comments presented on klseelwavetrading.blogspot.com are solely for education purpose only. They do not represent the opinions of klseelwavetrading.blogspot.com on whether to buy, sell or hold shares of a particular stock.
Investors should be cautious about any and all stock recommendations and should consider the source of any advice on stock selection. Various factors, including personal or corporate ownership, may influence or factor into an expert's stock analysis or opinion.
All investors are advised to conduct their own independent research into individual stocks before making a purchase decision. In addition, investors are advised that past stock performance is no guarantee of future price appreciation.


Sunday, September 27, 2015

Chin Well was Targeted by Institutional Investor ?

Chin Well Holding Berhad (Recession Proof Exporter)

Chin Well Holdings Berhad (CWHB) is a Malaysia-based investment holding company. The Company, through its subsidiaries operates in three segments: fastening products, which include the manufacturing and trading of screws, nuts, bolts and other fastening products; wire products, which include the manufacturing of precision galvanized wire, annealing wire, hard drawn wire, polyvinyl chloride (PVC) wire, bent round bar and BRC wire mesh, and investment holding.


Excluding Malaysia & Vietnam (main factory) which business is dominated in local currency (MYR, VND), Chin Well remaining 74.8% business is export, which is mainly dominated in Euro & USD. A recent appreciation in EURO and USD contributes a positive impact on the company in term of profit margin. While on the other hand, most of their costs are source locally, which promises a better earning prospect for FY16.

USDRMY

EURRMY


Key Ratio and Statistics

·         Total Asset RM571.5 million, Total Liabilities RM123.5 million, Total Equities RM448 million
·         Cash Per-Share RM0.19
·         Zero gearing/ Net cash, note that Chin Well finally turn into a net cash company in FY15 (note that, the company make an effort to reduce company gearing yearly)
·         Book Value Per-share RM1.58, Price to book value 0.90 times, which is very low (based on current price 1.42)
·         Reserves which is qualified for 1 for 1 bonus issue
·         Price to earning 10.3 times (based on current price 1.42)
·         Debt to Equity ratio 0.27x
·         Return on Equity 9.3x
·         Dividend Pay-out policy 40%


Chin Well (Completing they cycle of European recovery)

Chin Well business possesses its own defensive unique. In almost every major sector in the economy (automotive, construction, property development, furniture, oil & gas, technology) consumes Chin Well products. Based on the revenue breakdown above, we can see more than 56% of Chin Well products are exported to the European countries. While the extension of EU anti-dumping duty to the china fastener manufacturer for 5 years (March2015- March2020), grant Chin Well a big favor in term of business market share, as it is one of the eight companies in Malaysia that is exempted from this regulations.
The recent drop in the steel price furthermore boosts the company profit margin, as the raw material is accounted for 70% of its production cost. ECB Quantitative Easing, continues to spur European economic growth, and it is deems a great opportunity for the company to position itself for a greater and a better FY16 prospects. 
As according to the Executive Director Tsai Chia Ling, GST effect does them a favor as they could save up 4% of the tax rate as their current sales tax is at 10%. Other than that, according to her, Chin Well Vietnam plant operates at 90% capacity while Malaysia plant 50% capacity, which literally gives them an opportunity to cater their customer upcoming demand.

Recap on FA

Chinwel, is a lagging exporter company yet to be discovered, Net cash with good dividend yield and amazing future prospect and it undervalue counter as it should worth of >$1.70 

Technical Justification
Major trend Pattern has been defined as a TREND pattern, Wave 4 and 1 was overlap each other and all wave has CORRECTIVE internal Structure( ABC/WXY), Wave 4 was ended with Wave Y and I anticipated most likely wave 5 should take place and heading to $1.82/$2.80. I was bought in at $1.42 and will collect more on weakness $1.30 and my Stop loss is < $0.95.


For Instant update may join Telegram group by click the link below
https://telegram.me/joinchat/AmgzgAGYFMyNKsC-DQXLJQ

Trading Challenge

Many people committed to buy stock is very easy, when come to profit taking and cut loss is one of the most difficult part in trading world, talking about profit taking is dealing with greed and stop loss is dealing with fear, cutting loss is a must in trading world because it stopping my capital continue to loss, in order to stay alive in trading world... it is a must !!! it is not an option, else I suggest you get out of the trading and you are not suitable.

I wanted to used simple example to share on the cut loss ... you bought an egg and prepare to  used it for fry rice, some how you notice/suspect the eggs you pick was/may turn bad.... the question now is shall out throw/scrap the bad one and pick another .... or nevermind bet or hope the suspicious "bad" egg will be good and risk the good rice which is ready to cook ? you make the call... I am believed in order to win I got to know how to prevent I am loss in the market... if I notice I am wrong... I got to admit and cut the loss and make a next move.


As a reminder for myself
I am always remind myself If the trend is go again me and violated my SL limit, I will cut loss base on the risk preference.
Stop Loss is painful process because I making loss, but it is necessary to take it, it is very important because it protect my capital to ensure I am stay in the market.

DISCLAIMER:

Stock analysis and comments presented on klseelwavetrading.blogspot.com are solely for education purpose only. They do not represent the opinions of klseelwavetrading.blogspot.com on whether to buy, sell or hold shares of a particular stock.
Investors should be cautious about any and all stock recommendations and should consider the source of any advice on stock selection. Various factors, including personal or corporate ownership, may influence or factor into an expert's stock analysis or opinion.
All investors are advised to conduct their own independent research into individual stocks before making a purchase decision. In addition, investors are advised that past stock performance is no guarantee of future price appreciation.